
Constructing and analysing cladogramsSpec A3.2.6, A3.2.7
In short
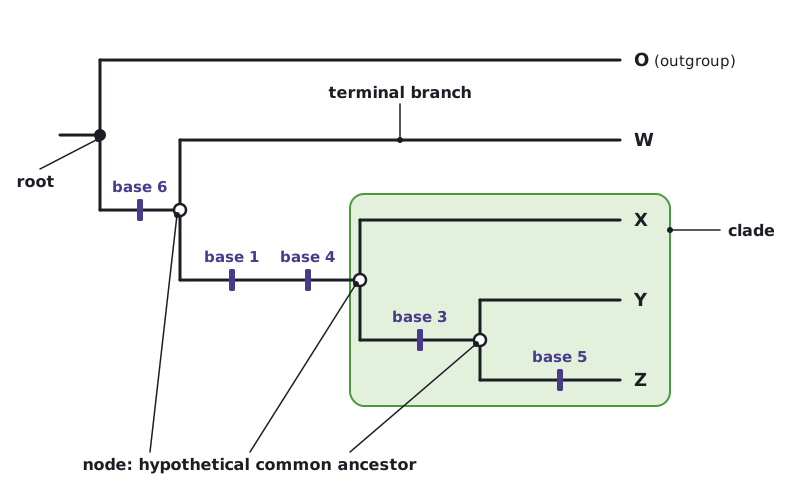
A cladogram is a tree diagram showing the most probable sequence of divergence in a group of clades. It is built from base sequences of genes or amino acid sequences of proteins, using parsimony to choose the tree needing the fewest sequence changes. Each node represents a hypothetical common ancestor; terminal branches end in the species compared.
- Cladogram
- A tree diagram that shows the most probable sequence of divergence in clades.
- Root
- The base of the cladogram, representing the common ancestor of all the organisms in it.
- Node
- A branching point, representing a hypothetical common ancestor that split into two lineages.
- Terminal branch
- A branch that ends at a species (or group) being compared, at the tips of the cladogram.
Constructing a cladogram from sequences
Base sequences of genes or amino acid sequences of proteins from the organisms are aligned and compared. Organisms with fewer differences are placed closer together. Many trees could fit the data, so parsimony analysis selects the most probable cladogram: the one in which the observed sequence variation is accounted for with the smallest number of sequence changes.
| Organism | Base 1 | Base 2 | Base 3 | Base 4 | Base 5 | Base 6 |
|---|---|---|---|---|---|---|
| O | A | C | G | T | A | C |
| W | A | C | G | T | A | G |
| X | T | C | G | A | A | G |
| Y | T | C | C | A | A | G |
| Z | T | C | C | A | T | G |
Choosing the most parsimonious cladogram
Use the sequences to deduce the most parsimonious cladogram for W, X, Y and Z.
- Base 6 (C→G) is shared by W, X, Y and Z: one change at the node joining all four.
- Bases 1 and 4 (A→T, T→A) are shared by X, Y and Z: two changes at the node joining X, Y and Z.
- Base 3 (G→C) is shared by Y and Z: one change at the node joining Y and Z.
- Base 5 (A→T) is found only in Z: one change on the terminal branch to Z.
- Total = 5 changes, one per variable base, which is the minimum possible. Any other tree, for example one grouping W with Z, needs extra changes.
Answer: O branches off first, then W, then X; Y and Z are the closest relatives (sister species).
Nature of science: different criteria for judgement can lead to different hypotheses. Parsimony is one criterion, so a cladogram is a hypothesis that can change with more data.
Analysing cladograms
- Each node represents a hypothetical common ancestor; the root is the common ancestor of every organism shown.
- A clade is any node together with everything that branches from it.
- Two species are most closely related if they share the most recent common ancestor (the node nearest the tips).
- Branches can be rotated about a node without changing the relationships, so the order of species along the tips does not matter.
- If branch lengths are drawn to scale, they show the amount of sequence change or the estimated time since divergence.
 (opens full size in a new tab)
Species next to each other at the tips are not necessarily closest relatives. Trace back to the node they share.
Written and checked against the IB Biology HL specification · Updated October 2026