
Investigating limiting factors on photosynthesisSpec C1.3.7
In short
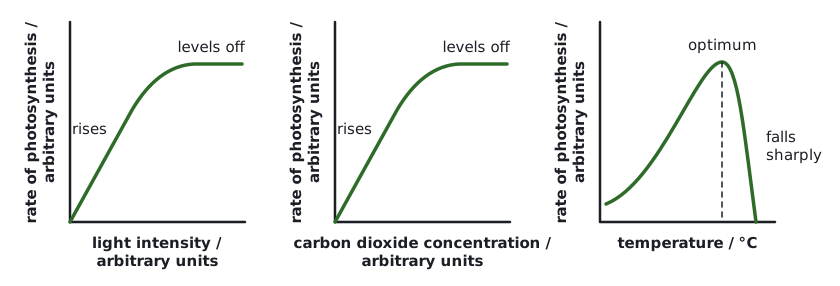
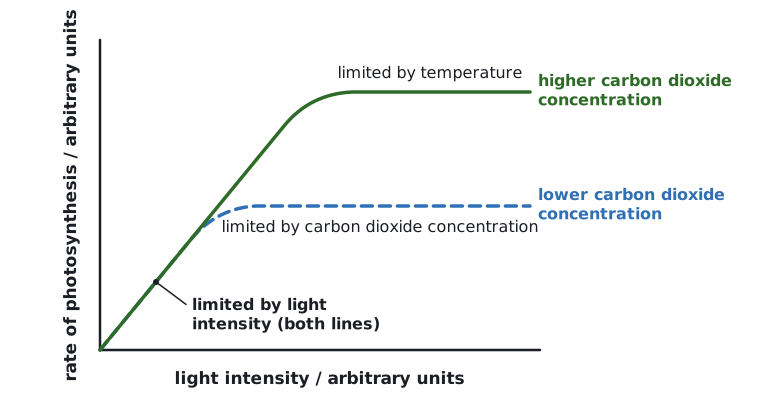
A limiting factor is the factor that is furthest from its optimum and so limits the rate of photosynthesis. Light intensity, carbon dioxide concentration and temperature can each be varied experimentally: lamp distance, sodium hydrogencarbonate solutions and water baths. The rate is measured from oxygen production or carbon dioxide uptake, while the other variables are kept constant.
The rate of photosynthesis depends on several factors. At any moment, the limiting factor is the one that is furthest from its optimum: increasing it raises the rate, while increasing the others does not.
 (opens full size in a new tab)
Techniques for varying each factor
| Independent variable | How to vary it | Notes |
|---|---|---|
| Light intensity | Change the distance of a lamp from the plant, or use filters or a dimmable LED | Light intensity falls with distance (roughly proportional to 1 ÷ distance²); use an LED or a heat shield so temperature does not change |
| Carbon dioxide concentration | Use different concentrations of sodium hydrogencarbonate solution around aquatic plants or leaf discs | Hydrogencarbonate releases CO₂ in water |
| Temperature | Place the plant in water baths at different temperatures | Allow time to equilibrate; check with a thermometer |
Measuring the rate
- Count bubbles or collect the volume of oxygen released by an aquatic plant such as Elodea or Cabomba per minute.
- Time how long leaf discs (with air removed so they sink) take to float as oxygen builds up.
- Measure carbon dioxide uptake with a sensor and data logger, or by the colour change of a hydrogencarbonate indicator.
 (opens full size in a new tab)
Identify the independent variable (the factor you change) and the dependent variable (the rate, for example oxygen per minute). Keep the other two factors constant and repeat each condition.
A hypothesis is a provisional explanation that needs repeated testing. You can suggest one from theory before the experiment (for example, 'rate rises with light intensity because more light energy is absorbed by chlorophyll') or from results after it.
Written and checked against the IB Biology HL specification · Updated October 2026