
Effects of temperature, pH and substrate concentrationSpec C1.1.8, C1.1.9
In short
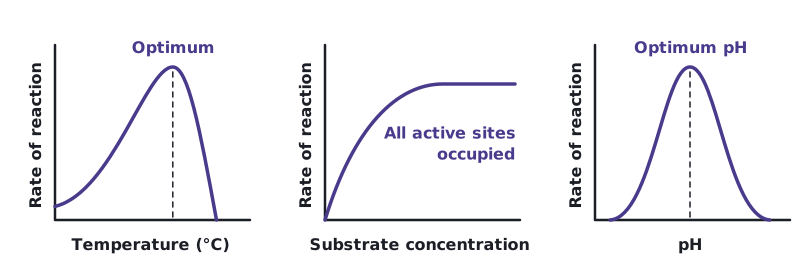
Enzyme activity rises with temperature up to an optimum, because faster molecules collide more often, then falls as the enzyme denatures. Activity is highest at an optimum pH and falls either side as the active site changes. Rate rises with substrate concentration until all active sites are occupied. Rate is measured as product formed or substrate used per unit time.
 (opens full size in a new tab)
Temperature
As temperature rises, enzyme and substrate molecules have more kinetic energy and move faster. Collisions between substrate and active site become more frequent and more of them have enough energy to react, so the rate increases. Above the optimum temperature, the extra vibration breaks bonds holding the enzyme's structure; more and more enzyme molecules denature, so the rate falls steeply. The curve is not symmetrical: the fall is much steeper than the rise.
pH
Each enzyme has an optimum pH. A change in pH alters the concentration of hydrogen ions, which changes the charges on R groups in the active site and elsewhere. Ionic and hydrogen bonds are disrupted, so the substrate binds less well and the rate falls on either side of the optimum. Far from the optimum the enzyme is denatured. For example, pepsin in the stomach works best in acid conditions, while many enzymes in the small intestine work best near neutral pH.
Substrate concentration
At low substrate concentrations, raising the concentration increases the frequency of substrate–active site collisions, so the rate rises steeply. As the concentration increases further, more active sites are occupied at any moment, so the rise slows. Eventually all active sites are occupied nearly all the time and the rate levels off at a maximum. Enzyme concentration is then the limiting factor.
Sketch graphs like these are models. They can be evaluated by comparing them with real results from enzyme experiments. When describing a graph, give the trend, the optimum or the plateau, and quote values with units.
Measurements in enzyme-catalysed reactions
The rate of an enzyme-catalysed reaction is measured as the amount of product formed or substrate used per unit time. Common methods include measuring the volume of oxygen released when catalase breaks down hydrogen peroxide (gas syringe or displacement of water), and timing how long starch takes to disappear when amylase acts on it (samples tested with iodine). Rates can also be found from secondary data.
- Mean rate = change in amount ÷ time taken.
- Initial rate: draw a tangent to the curve at time zero and find its gradient. This is the fairest comparison because the substrate concentration has not yet fallen.
- If only a time is measured (for example, time for starch to disappear), rate can be expressed as 1 ÷ time.
Calculating rates from enzyme data
Catalase was added to hydrogen peroxide. 18 cm³ of oxygen was collected in the first 30 s and 30 cm³ by 90 s. Calculate the mean rate over the first 30 s and over the whole 90 s.
- First 30 s: rate = 18 cm³ ÷ 30 s = 0.60 cm³ s⁻¹.
- Whole 90 s: rate = 30 cm³ ÷ 90 s = 0.33 cm³ s⁻¹.
- The rate falls over time because substrate is used up, so there are fewer collisions with active sites.
Answer: 0.60 cm³ s⁻¹ over the first 30 s; 0.33 cm³ s⁻¹ over 90 s.
Control temperature with a thermostatically controlled water bath, pH with buffer solutions, and keep enzyme concentration and volumes constant. Repeat each condition at least three times and calculate a mean.
Written and checked against the IB Biology HL specification · Updated October 2026