
The Keeling CurveSpec C4.2.20
In short
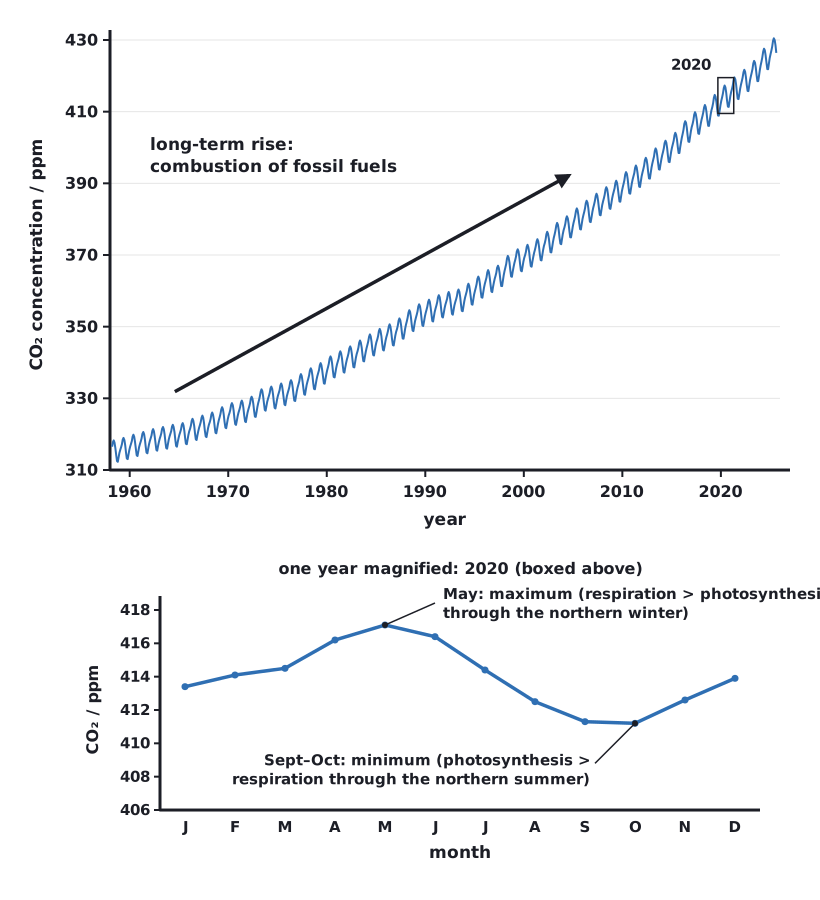
The Keeling Curve is the record of atmospheric carbon dioxide concentration measured at Mauna Loa, Hawaii, since 1958. Each year CO₂ falls in the northern summer, when photosynthesis exceeds respiration, and rises in winter, when respiration exceeds photosynthesis. The long-term rise, from about 315 ppm to over 420 ppm, is caused mainly by combustion of fossil fuels.
Measurements of CO₂ at the Mauna Loa Observatory, high on a volcano in Hawaii and far from local pollution, began in 1958. The graph shows two patterns.
| Pattern | Description | Explanation |
|---|---|---|
| Annual fluctuation | A saw-tooth of about 6 ppm each year: highest around May, lowest around September–October | Most land and vegetation is in the northern hemisphere. In the northern spring and summer, photosynthesis exceeds respiration, so CO₂ falls. In autumn and winter, leaves fall and photosynthesis slows while respiration (especially by decomposers) continues, so CO₂ rises |
| Long-term trend | A steady rise, from about 315 ppm in 1958 to over 420 ppm in the 2020s, getting steeper over time | Combustion of fossil fuels (and deforestation) releases CO₂ faster than photosynthesis and the oceans remove it |
 (opens full size in a new tab)
When analysing the Keeling Curve, explain both patterns: the annual cycle in terms of photosynthesis and respiration, the long-term trend in terms of combustion. Quote values with units (ppm) and calculate a rate of increase where asked.
Linking question: what are the direct and indirect consequences of rising carbon dioxide levels in the atmosphere? Link to the enhanced greenhouse effect (D4.3) and ocean acidification.
Written and checked against the IB Biology HL specification · Updated October 2026