
Evidence for climate changeSpec 5.16
In short
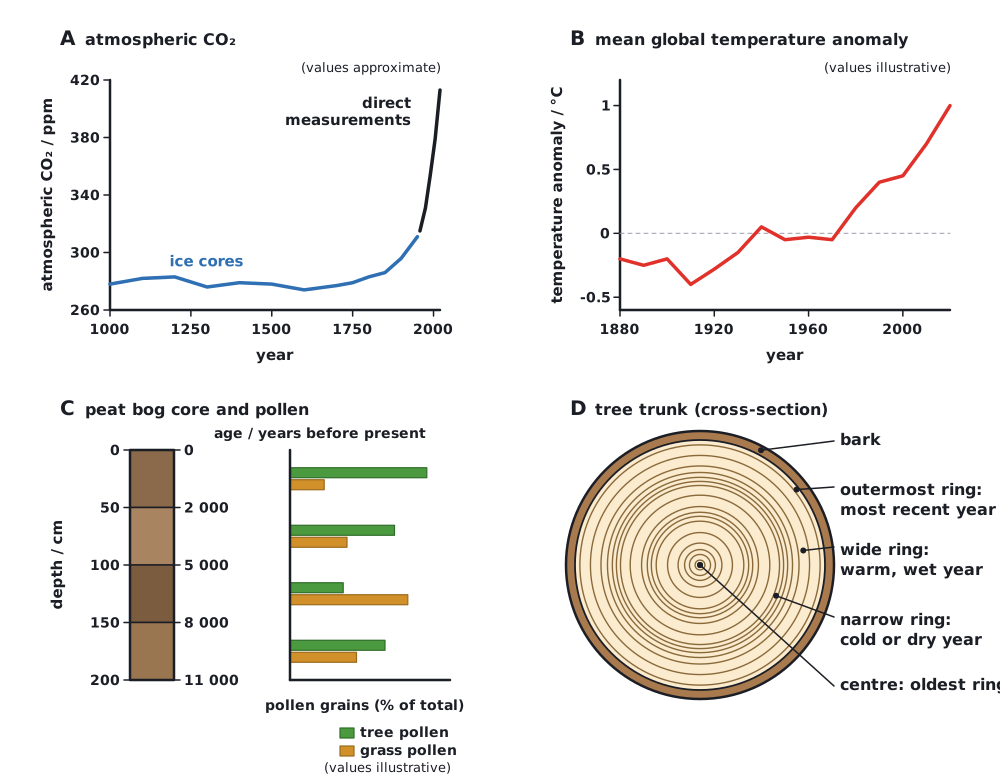
Evidence for past and present climate change comes from direct records of carbon dioxide levels and temperature, and from indirect evidence such as pollen preserved in peat bogs and the width of tree rings (dendrochronology). Climate change is judged by recognising correlations and then deciding whether the evidence also shows a causal relationship.
| Evidence | What is measured | What it shows | Limitations |
|---|---|---|---|
| Carbon dioxide records | Direct measurement of atmospheric CO₂ (for example continuous measurements since the 1950s); CO₂ in air bubbles trapped in ice cores for earlier times | A rise in atmospheric CO₂ concentration, with a steep rise since the industrial revolution; ice cores cover hundreds of thousands of years | Ice-core values are indirect and become less precise further back; local sources can affect some records |
| Temperature records | Thermometer readings from weather stations, ships and satellites; earlier temperatures estimated from other evidence | Mean global temperature has risen, especially since about 1950 | Coverage of early records is patchy; local effects such as urban heating; different measurement methods |
| Pollen in peat bogs | Pollen grains preserved in the acidic, anaerobic (waterlogged) layers of peat. Layers are dated (for example by radiocarbon dating) and the pollen is identified and counted | The species of plants present at different times. Each species has a climate it tolerates, so the pollen record shows what the climate was like | Pollen can be blown from elsewhere; plants respond to other factors, such as soil and human activity; identification to species level can be hard |
| Dendrochronology (tree rings) | Counting and measuring the width of annual rings in trees. Overlapping patterns of ring widths from living and dead trees extend the record | Wide rings suggest warm, wet years with good growth; narrow rings suggest cold or dry years. Gives precise dates for past conditions | Growth is also affected by disease, competition and nutrients; only tells about local conditions; limited to areas where trees grow |
 (opens full size in a new tab)
Correlation and causation
Data from different sources can be compared on one graph. A correlation exists where two variables change together, for example atmospheric CO₂ concentration and mean global temperature. A correlation alone does not show that one causes the other: both could be caused by a third factor. A causal relationship is supported when there is also a known mechanism (here the greenhouse effect), the correlation is seen repeatedly in many independent data sets, and the cause comes before the effect.
In data questions say 'there is a positive correlation between …' and then discuss whether it shows cause. Use evidence such as a known mechanism and data from several independent sources to support a causal link.
Written and checked against the Edexcel International A Level Biology (YBI11) specification · Updated October 2026