
Electrocardiograms (ECGs)Spec 7.12(iii)
In short
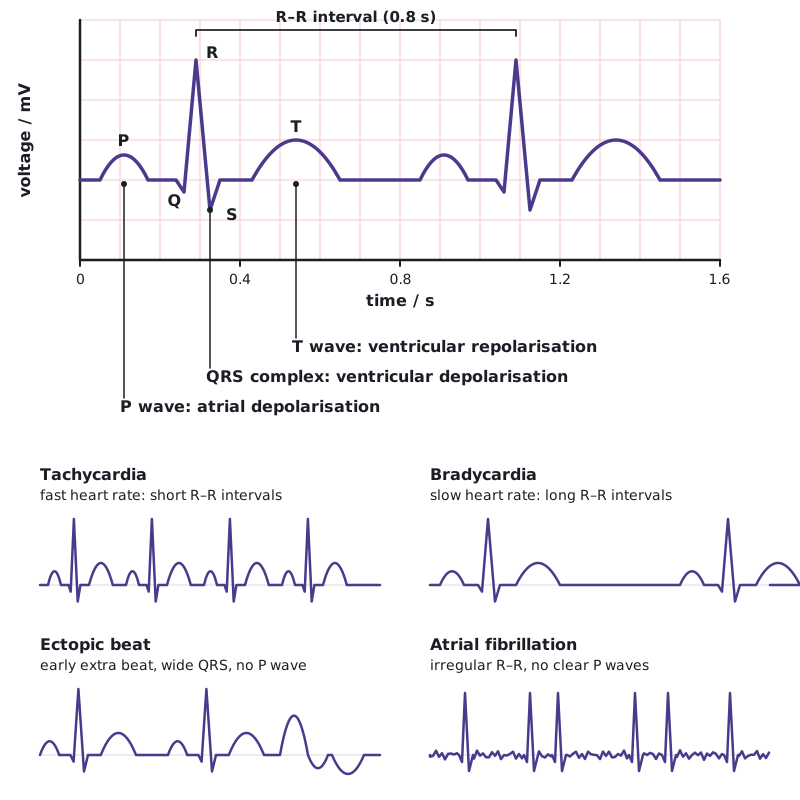
An electrocardiogram (ECG) records the electrical activity of the heart from electrodes on the skin. The P wave shows atrial depolarisation, the QRS complex ventricular depolarisation and the T wave ventricular repolarisation. Changes in rate, spacing and shape help diagnose abnormal heart rhythms such as tachycardia, bradycardia, ectopic beats and atrial fibrillation.
An electrocardiogram (ECG) is a trace of the electrical changes produced by the heart, recorded by electrodes on the skin. One heartbeat gives a repeating pattern of waves.
| Feature | What it shows |
|---|---|
| P wave | Depolarisation of the atria (just before atrial systole) |
| QRS complex | Depolarisation of the ventricles (just before ventricular systole) |
| T wave | Repolarisation of the ventricles (as they relax) |
| R–R interval | Time for one complete heartbeat |
Abnormal rhythms shown on an ECG
| Condition | ECG appearance |
|---|---|
| Tachycardia | Regular pattern, but a rapid heart rate (above 100 beats per minute): short R–R intervals |
| Bradycardia | Regular pattern, but a slow heart rate (below 60 beats per minute): long R–R intervals |
| Ectopic heartbeat | An extra or early beat, then a longer gap before the next normal beat |
| Atrial fibrillation | Irregular, rapid atrial activity: no clear P waves and an irregular R–R interval |
To find heart rate from an ECG, measure the time between two R peaks from the scale given, then divide 60 by it. For example, an R–R interval of 0.8 s gives 75 beats per minute.
 (opens full size in a new tab)
Written and checked against the Edexcel International A Level Biology (YBI11) specification · Updated October 2026