
Core practical 11: a study of the ecology of a habitatSpec 5.14
In short
Core practical 11 is a study of a habitat using quadrats and transects to measure the distribution and abundance of organisms, together with measurements of abiotic factors. Random sampling is used to estimate abundance across an area, and systematic sampling along a transect shows how distribution changes along an environmental gradient.
Core practical 11: carry out a study of the ecology of a habitat, such as using quadrats and transects to determine the distribution and abundance of organisms, and measuring abiotic factors appropriate to the habitat.
Choosing the sampling method
| Method | Use | How it is done |
|---|---|---|
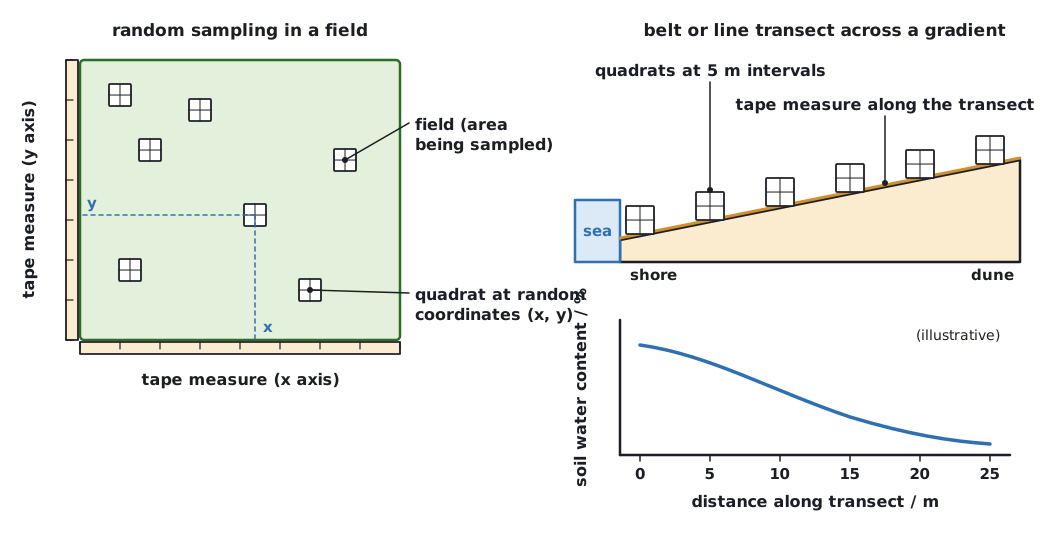
| Random sampling with quadrats | To estimate the abundance (and mean density or percentage cover) of organisms across an area, avoiding bias | Lay out two tape measures at right angles to form a grid. Use random numbers (from a calculator or table) as coordinates for each quadrat. Place the quadrat at each point |
| Systematic sampling along a transect | To show how the distribution of organisms changes along an environmental gradient (for example from the sea shore or up a slope) | Stretch a tape measure along the gradient. Place a quadrat at regular intervals (an interrupted belt transect) or record species touching the line (a line transect) |
A quadrat is a square frame, often 0.25 m² or 1 m². In each quadrat, record the abundance of each species. Use percentage cover for plants that are difficult to count as individuals, such as grass, and count individuals for animals and larger plants. A frequency measure counts how many of the squares in a gridded quadrat contain the species.
Estimating a population
Ten 0.25 m² quadrats were placed randomly in a field of area 2 000 m². A total of 35 daisy plants were counted in the quadrats. Estimate the population size of daisies in the field.
- Total area sampled = 10 × 0.25 = 2.5 m²
- Mean per m² = 35 ÷ 2.5 = 14
- Population = 14 × 2 000
Answer: 28 000 daisy plants
 (opens full size in a new tab)
Measuring abiotic factors
Measure abiotic factors at each quadrat so that distribution can be linked to environment. The factors chosen depend on the habitat. Examples are light intensity (light meter), soil or water pH (pH meter or probe), soil moisture (moisture meter, or mass lost on drying), temperature (thermometer or probe), wind speed (anemometer), and salinity or dissolved oxygen (probe). Take several readings and calculate a mean.
Reliability, safety and ethics
- Use a large enough sample (for example 10 to 30 quadrats) so that the mean is representative. Sample size is large enough when the running mean stops changing.
- Identify species using a key; use the same sampling effort and the same person where possible, and record the time of day and the season.
- Link the distribution of a species to an abiotic factor by plotting both against distance on a graph, and use a statistical test (for example a correlation test) to find whether the relationship is significant. Correlation does not by itself show cause.
- Risks: slips and trips, sun, ticks, contaminated water, sharp objects. Wear suitable clothing and footwear, check weather and tides, work in pairs and wash hands.
- Cause as little damage as possible to the habitat: take quadrats carefully, do not trample the vegetation more than needed, return any animals, and obtain permission to sample.
If asked why sampling is random, say it avoids bias in choosing where to place quadrats. If asked why a transect is used, say it samples across a gradient, so changes in distribution can be linked to a change in an abiotic factor.
Written and checked against the Edexcel International A Level Biology (YBI11) specification · Updated October 2026