
The bacterial growth curve and growth rate constantsSpec 6.3
In short
A bacterial growth curve in a closed culture has four phases: lag, when cells adjust and little division occurs; exponential, when the population doubles each generation; stationary, when divisions equal deaths; and death, when deaths exceed divisions. The exponential growth rate constant is generations per unit time.
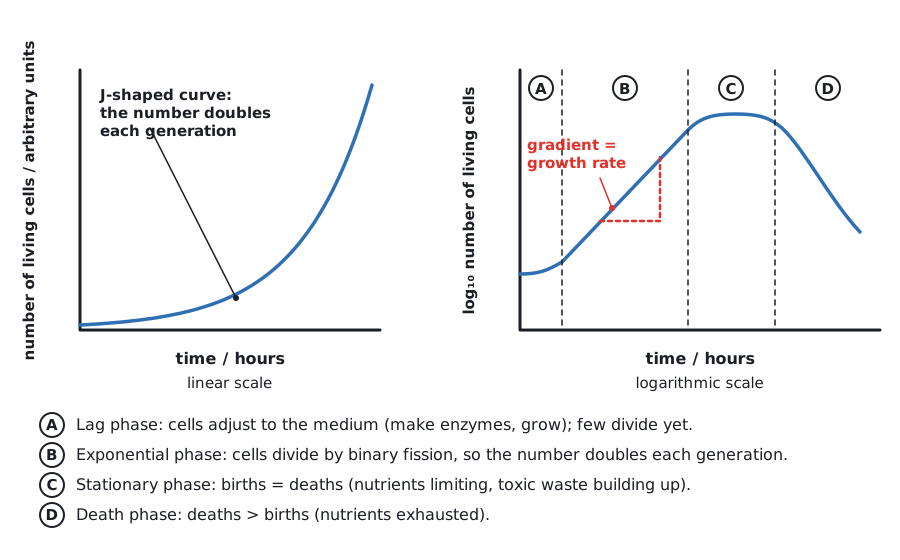
When bacteria are inoculated into a fixed volume of broth (a closed culture, with no nutrients added or waste removed) and the number of living cells is plotted against time, the curve has four phases. Cell number is usually plotted as log₁₀ so that the very large range fits on the graph and the exponential phase appears as a straight line.
| Phase | What happens to cell number | Why |
|---|---|---|
| Lag phase | Little or no increase | Cells are adjusting to the new medium: they take up nutrients, synthesise enzymes and ribosomes, and grow in size; few cells divide yet |
| Exponential (log) phase | Doubles every generation: fastest rate of increase | Nutrients and space are plentiful and there is little waste; cells divide by binary fission at a constant rate, so the number of cells doubles in each generation time |
| Stationary phase | Constant: births equal deaths | Nutrients become limiting, toxic waste (for example acids that lower the pH) accumulates and oxygen may run short, so division slows until the rate of division equals the rate of death |
| Death (decline) phase | Falls | Nutrients are exhausted and toxic waste is high, so more cells die than divide |
 (opens full size in a new tab)
Exponential growth and growth rate constants
In the exponential phase each cell divides once per generation time (the time for the population to double). After n generations a population starting with N₀ cells has Nₙ = N₀ × 2ⁿ cells. Rearranging with logarithms gives the number of generations from the start and end numbers.
The constant 0.301 is log₁₀ 2. The growth rate constant k is the number of generations per unit time during the exponential phase; it is the gradient of the straight line on a graph of log₂ (cell number) against time, or the gradient of log₁₀ cell number against time divided by 0.301.
Growth rate constant
A broth culture contained 2.0 × 10³ cells per cm³ at the start of the exponential phase and 1.28 × 10⁵ cells per cm³ 6 hours later. Calculate the exponential growth rate constant.
- log₁₀ (1.28 × 10⁵) = 5.107 and log₁₀ (2.0 × 10³) = 3.301, so the difference is 1.806.
- Number of generations, n = 1.806 ÷ 0.301 = 6.0.
- k = n ÷ t = 6.0 ÷ 6 h = 1.0 generation per hour (generation time 1 hour).
Answer: k = 1.0 generation per hour
Logarithms on a calculator and reading a log scale are IAL-only skills (A.0.5, A.2.5). If a question does not give the formula, show the doubling idea: 1.28 × 10⁵ ÷ 2.0 × 10³ = 64 = 2⁶, so 6 generations.
Do not say that cells 'stop dividing' in the stationary phase. The correct idea is that the rate of division equals the rate of death, so the number of living cells is constant.
Written and checked against the Edexcel International A Level Biology (YBI11) specification · Updated October 2026