
Core practical 13: rate of growth in liquid cultureSpec 6.4
In short
Core practical 13 investigates growth in a liquid culture by inoculating broth, keeping one variable different, taking samples or readings at regular intervals and plotting cell number or absorbance against time. Only safe, non-pathogenic strains are used, with aseptic technique and proper disposal.
Core practical 13: Investigate the rate of growth of microorganisms in a liquid culture, taking into account the safe and ethical use of organisms.
A typical investigation uses a harmless organism, such as baker's yeast (Saccharomyces cerevisiae) or a non-pathogenic strain of Escherichia coli, in nutrient broth, and asks how the rate of growth is affected by an independent variable such as temperature, pH or glucose concentration.
Method
- Prepare sterile broth and set up identical flasks or tubes, each with the same volume of broth and the same starting cell density. Use aseptic technique throughout.
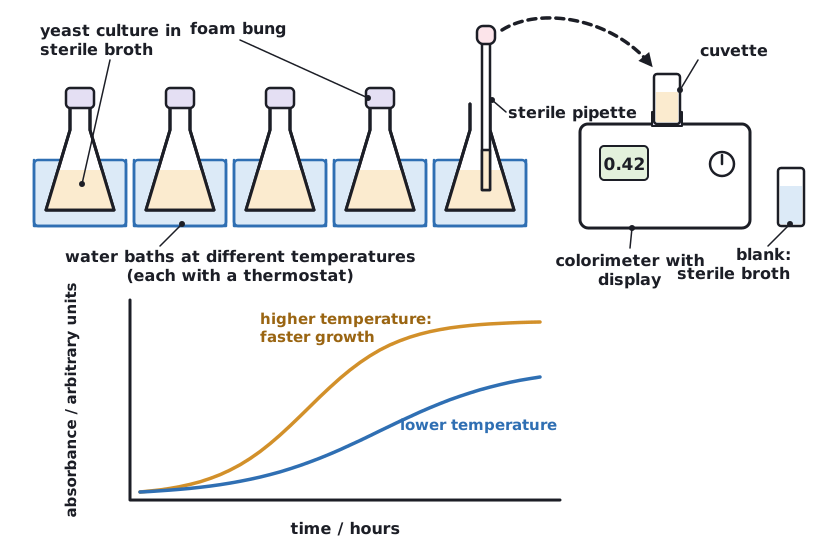
- Set the independent variable (for example water baths at 20, 25, 30, 35 and 40 °C for yeast, or broth at different pH).
- Inoculate each flask with the same volume of culture, mix gently, and take a time-zero reading.
- At regular intervals (for example every 30 or 60 minutes for several hours) swirl to resuspend and remove a sample with a sterile pipette. Measure absorbance in a colorimeter using sterile broth as the blank, or do a haemocytometer count or dilution plating.
- Repeat each condition at least three times and calculate mean readings.
- Plot cell number or absorbance (or log₁₀ of it) against time and compare gradients of the exponential phase, or calculate the growth rate constant k for each condition.
| Type | Examples |
|---|---|
| Independent variable | Temperature, pH, glucose concentration or antibiotic concentration |
| Dependent variable | Cell number or absorbance over time (rate of growth = change in cell number ÷ time, or k) |
| Controlled variables | Volume and type of broth; starting cell density and volume of inoculum; strain of organism; aeration or shaking; light; time between readings; same colorimeter wavelength and cuvettes |
Processing results
Rate of growth in the exponential phase is the gradient of a line on the graph. For a curved graph, draw a tangent to find the gradient at a given time. A growth rate constant can be found from the number of generations per hour. Compare the means for each condition and say whether differences are likely to be real, using error bars or range.
Safe and ethical use of organisms
- Use only non-pathogenic strains, such as laboratory strains of yeast or E. coli K12, and never culture samples from the environment or from people, which could contain pathogens.
- Carry out a risk assessment; wear a lab coat and gloves, tie back hair, cover cuts, wash hands, and disinfect the bench before and after.
- Use aseptic technique, incubate at 25 °C or lower for bacteria in school, and tape the lids on any plates.
- Autoclave or disinfect all cultures and equipment before disposal; do not tip live cultures down the sink.
- Ethical use: microorganisms are living organisms, so use only as many as are needed, plan to avoid repeating work unnecessarily, and kill (autoclave) and dispose of cultures responsibly once finished.
In a planning question give a named strain that is safe, a reason for each control, and what you will do with the cultures afterwards. These are easy marks that are often missed.
 (opens full size in a new tab)
Quick check
Why are Petri dishes incubated upside down?
Show answer
So condensation collects in the lid and does not drip on to the agar and spread colonies.
What does a viable count measure that a total cell count does not?
Show answer
Only living cells that can divide to form colonies.
Name the four phases of the bacterial growth curve in order.
Show answer
Lag, exponential (log), stationary, death (decline).
What is the formula for the number of generations from the start and end numbers of cells?
Show answer
n = (log₁₀ Nₜ − log₁₀ N₀) ÷ 0.301.
Why is a colorimeter blank of sterile broth used in core practical 13?
Show answer
To set zero absorbance for the broth alone, so readings show only the cloudiness caused by the cells.
Written and checked against the Edexcel International A Level Biology (YBI11) specification · Updated October 2026