
Core practical 4: the initial rate of enzyme-catalysed reactionsSpec 2.8
In short
In core practical 4, you change one factor (temperature, pH, enzyme concentration or substrate concentration) and measure the initial rate of an enzyme-catalysed reaction, for example the volume of oxygen produced by catalase. The initial rate is found from the gradient of the tangent at time zero on a graph of product against time.
Core practical 4: investigate the effect of temperature, pH, enzyme concentration and substrate concentration on the initial rate of enzyme-catalysed reactions.
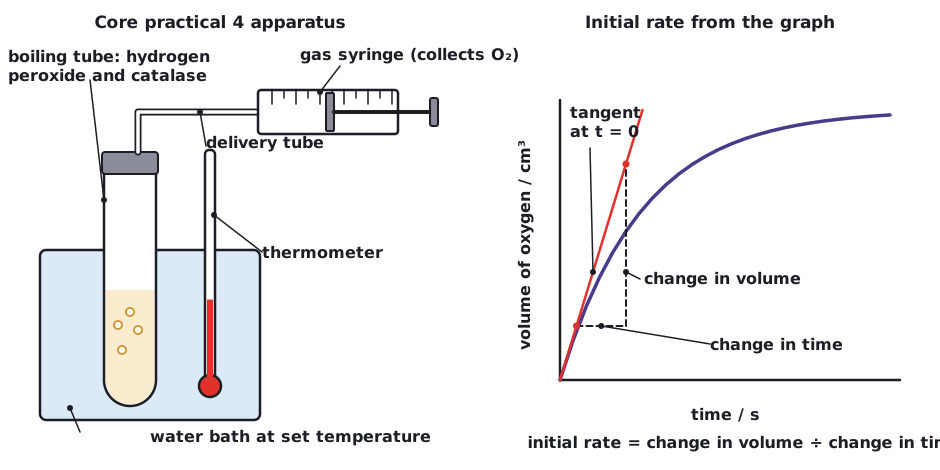
A suitable system is catalase breaking down hydrogen peroxide into water and oxygen. The oxygen is collected, and the volume is measured over time. (Other systems also work, for example amylase and starch, where the time for the iodine colour to disappear is measured, or the breakdown of milk protein by a protease.)
- Place a fixed volume of hydrogen peroxide solution, adjusted to the chosen pH with a buffer, in a boiling tube and bring it to the chosen temperature in a water bath.
- Add a fixed volume of catalase solution (for example from yeast or liver) and immediately connect a delivery tube to a gas syringe or an upturned measuring cylinder over water.
- Start a stopwatch. Record the volume of oxygen at regular intervals (for example every 10 seconds) for several minutes.
- Repeat at least three times for each value of the independent variable, and calculate a mean.
| Independent variable | How to change it | Keep constant |
|---|---|---|
| Temperature | Water baths at, for example, 10, 20, 30, 40, 50 and 60 °C. | pH (buffer), enzyme concentration and volume, substrate concentration and volume. |
| pH | Buffer solutions of different pH, for example pH 3 to 10. | Temperature, enzyme and substrate concentrations and volumes. |
| Enzyme concentration | Dilute the enzyme stock to give a range of concentrations (serial dilution). | Temperature, pH, substrate concentration and volume. |
| Substrate concentration | Dilute hydrogen peroxide stock to a range of concentrations. | Temperature, pH, enzyme concentration and volume. |
Risk management
- Hydrogen peroxide is an irritant (and stronger solutions are corrosive): wear eye protection and gloves, and wash splashes off skin.
- Do not use a very high concentration of enzyme with high hydrogen peroxide, because the gas is evolved quickly: use a gas syringe or a measuring cylinder that is big enough.
- Hot water baths can scald.
Finding the initial rate
Plot the volume of product (y axis) against time (x axis). The curve is steepest at the start, then levels off as substrate is used up. Draw a tangent to the curve at time zero, and calculate its gradient. The gradient is the initial rate.
Initial rate from a graph
A tangent drawn to the curve at time zero passes through the points (0 s, 0 cm³) and (20 s, 14 cm³). Calculate the initial rate of the reaction.
- Initial rate = change in volume ÷ change in time.
- = (14 − 0) cm³ ÷ (20 − 0) s.
- = 0.70 cm³ s⁻¹.
Answer: 0.70 cm³ s⁻¹ (the unit is cm³ per second).
Use a large triangle on the tangent to find the gradient. If the rate is taken from a data table instead, use the first, steepest interval. Give the unit (for example cm³ s⁻¹ or mm³ min⁻¹). Percentage change is also used to compare rates between treatments: (new − original) ÷ original × 100.
In an evaluation, enzymes at different temperatures must be brought to temperature before they are mixed. Otherwise the reaction starts at the wrong temperature and the initial rate is not valid.
 (opens full size in a new tab)
Quick check
Name the bond that links two amino acids.
Show answer
A peptide bond (covalent), formed in a condensation reaction that releases water.
Which bonds hold the tertiary structure of a protein?
Show answer
Hydrogen bonds, ionic bonds and disulfide bonds (plus hydrophobic interactions).
Why is haemoglobin soluble?
Show answer
Hydrophilic R groups face outwards, so it dissolves in the cytoplasm of red blood cells.
What does an enzyme do to the activation energy of a reaction?
Show answer
It lowers it.
How is the initial rate of reaction found from a graph?
Show answer
From the gradient of the tangent drawn at time zero on a graph of product against time.
Written and checked against the Edexcel International A Level Biology (YBI11) specification · Updated October 2026