
Sampling: random sampling, sample size and avoiding biasSpec S7
In short
Random sampling is choosing samples so that every individual or position has an equal chance of being chosen, for example using random number coordinates on a grid of tape measures. It avoids bias, which can happen when you choose positions yourself or throw a quadrat. A larger sample size, such as 10 to 20 quadrats, makes results more representative.
It is usually impossible to count or measure every organism, so you take a sample. The sample must be representative of the whole population and must avoid bias.
- Representative sample
- A sample that has the same features as the whole population or area it comes from.
- Bias
- When the way a sample is chosen makes some results more likely than others, for example picking the largest leaves.
- Simple random sampling
- Choosing samples so that every individual or position has an equal chance of being chosen, for example using random numbers.
Random sampling with a quadrat
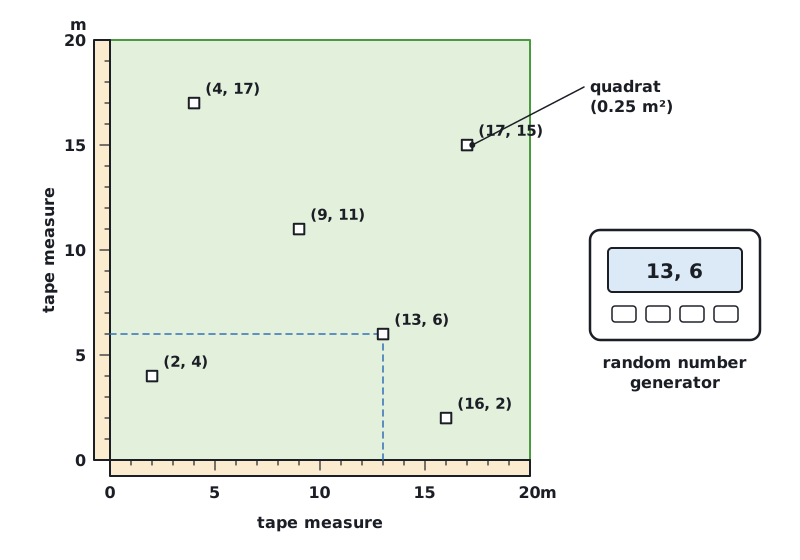
- Lay two tape measures at right angles along two edges of the area to make a grid.
- Use a random number generator (or random number table) to pick two coordinates.
- Place the quadrat at that point and count the chosen species inside it.
- Repeat for many quadrats, for example 10 to 20.
- Calculate the mean number per quadrat.
 (opens full size in a new tab)
Sample size and bias
- A larger sample size makes the results more representative and reduces the effect of any one unusual sample.
- Choosing positions yourself, or throwing the quadrat, can introduce bias, because you may pick areas that look interesting.
- For variation studies, choose individuals at random, for example measure every tenth leaf, or leaves from randomly chosen plants, not just the biggest ones.
- Keep the method the same for every sample: the same quadrat size and the same person counting.
Random sampling avoids bias. A large sample makes the results representative. Learn these two phrases as a pair.
Safety outdoors: wear gloves or wash your hands after handling soil and plants, take care near water and do not touch plants you cannot identify.
Quick check
How should a column heading for time in seconds be written?
Show answer
time / s
Which variable goes on the x-axis?
Show answer
The independent variable, unless told otherwise.
State the formula for magnification.
Show answer
magnification = image size ÷ actual size
What colour does hydrogencarbonate indicator turn when carbon dioxide increases?
Show answer
Yellow (from red).
Why should quadrats be placed at random?
Show answer
To avoid bias.
Written and checked against the Cambridge IGCSE Biology (0610) specification · Updated October 2026