
Carbon dioxide enrichment experimentsSpec C1.3.8
In short
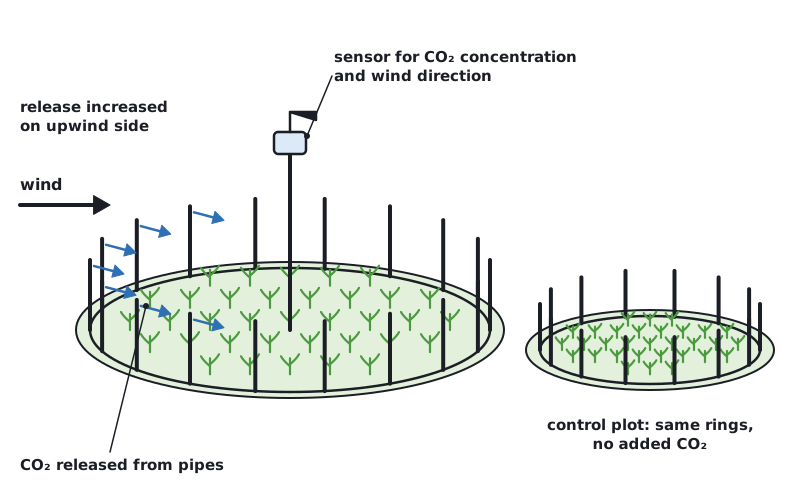
Carbon dioxide enrichment experiments grow plants at higher CO₂ concentrations than today's to predict future rates of photosynthesis and plant growth. Enclosed greenhouse experiments allow careful control of variables. Free-air carbon dioxide enrichment (FACE) experiments release CO₂ over plots in the field, so plants grow in natural conditions, but other variables are harder to control.
Atmospheric carbon dioxide concentration is rising. Carbon dioxide enrichment experiments grow plants at concentrations predicted for the future to find out how rates of photosynthesis and plant growth may change.
| Enclosed greenhouse experiments | Free-air CO₂ enrichment (FACE) | |
|---|---|---|
| Set-up | Plants grown in closed glasshouses or chambers with CO₂ added to the air | Rings of pipes release CO₂ around plots in a field or natural ecosystem; sensors adjust the release to hold a target concentration |
| Control of variables | Easier: temperature, light, water and minerals can be controlled | Harder: weather, soil and pests vary, but affect treated and control plots similarly |
| How realistic | Less natural: enclosure changes temperature, humidity and wind | More realistic: plants grow in field conditions with other species |
| Control | Identical greenhouse at current CO₂ | Plots with the same ring structure but no added CO₂ |
Higher carbon dioxide generally increases the rate of photosynthesis and growth, at least for a time. However, several FACE studies of crops found smaller increases in growth and yield than enclosed experiments had predicted (the size of the gap is still debated). In the field, other factors such as water, temperature or soil nitrogen can become limiting, and the effect of extra CO₂ can shrink over the years.
Be able to identify a controlled variable, such as plant species, light intensity in a greenhouse, or plot size in a FACE experiment. Field experiments are less controlled than laboratory ones, but some questions can only be answered in natural ecosystems.
 (opens full size in a new tab)
Quick check
Write the word equation for photosynthesis.
Show answer
carbon dioxide + water → glucose + oxygen
Where does the oxygen released by photosynthesis come from?
Show answer
The splitting of water.
How is an Rf value calculated?
Show answer
Distance moved by the pigment ÷ distance moved by the solvent front.
What is the difference between an absorption spectrum and an action spectrum?
Show answer
An absorption spectrum shows light absorbed by a pigment at each wavelength; an action spectrum shows the rate of photosynthesis at each wavelength.
Written and checked against the IB Biology SL specification · Updated October 2026