
Pedigree chartsSpec D3.2.13
In short
A pedigree chart shows the inheritance of a trait through several generations of a family, with squares for males, circles for females and shading for affected individuals. Patterns in the chart allow deduction of whether a disorder is dominant, recessive or sex-linked, and then the genotypes of particular individuals.
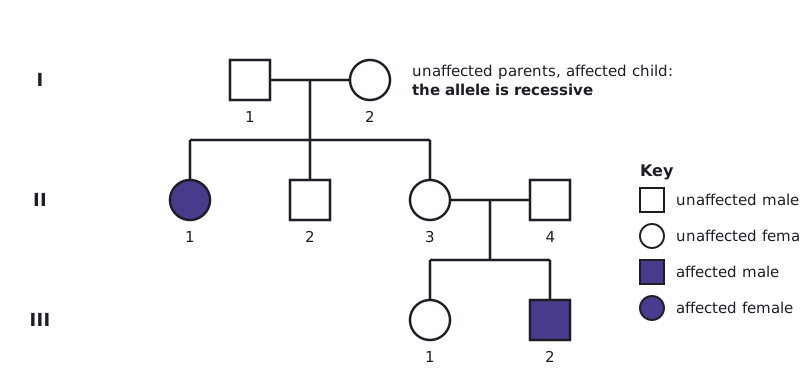
In a pedigree chart, squares are males and circles are females, shaded if affected. A horizontal line joins parents, and a vertical line leads down to their children. Generations are numbered with Roman numerals (I, II, III) and individuals with numbers.
| Pattern | Clues in the pedigree |
|---|---|
| Autosomal recessive | Two unaffected parents have an affected child, so both parents must be carriers; males and females affected equally |
| Autosomal dominant | Every affected individual has at least one affected parent; two affected parents can have an unaffected child |
| Sex-linked (X-linked) recessive | Mostly males affected, usually with unaffected carrier mothers; an affected father never passes it to his sons |
 (opens full size in a new tab)
Inductive and deductive reasoning
Working out the pattern from part of a pedigree is inductive reasoning: a general conclusion (a theory) from some but not all cases. Using that theory to work out the genotypes of specific individuals is deductive reasoning.
Marriage between close relatives
Close relatives share many alleles inherited from common ancestors. If both partners carry the same rare recessive allele, each child has a 0.25 chance of being homozygous recessive and affected. This is the genetic basis for the prohibition of marriage between close relatives in many societies.
When deducing a pattern, quote the individuals: for example, 'II-1 is affected but I-1 and I-2 are not, so the allele is recessive'.
Written and checked against the IB Biology SL specification · Updated October 2026