
Absorption of light, absorption spectra and action spectraSpec C1.3.5, C1.3.6
In short
Photosynthetic pigments absorb specific wavelengths of light: chlorophyll absorbs mainly red and blue light and reflects green. Absorbed light excites electrons within the pigment molecule, transforming light energy to chemical energy. An absorption spectrum shows how much light a pigment absorbs at each wavelength; an action spectrum shows the rate of photosynthesis at each wavelength. Their peaks are similar.
Absorption of specific wavelengths
When a pigment molecule absorbs light, the energy excites an electron within the molecule, raising it to a higher energy level. This is the first step in transforming light energy to chemical energy, because the excited electron can be passed on to other molecules.
Only some wavelengths are absorbed. Electrons in a pigment can only occupy certain energy levels, so only photons whose energy matches the gap between levels can be absorbed. Other wavelengths are reflected or transmitted. Chlorophyll absorbs red and blue light most strongly and reflects green light, which is why leaves look green. Accessory pigments such as carotenoids absorb other wavelengths, mainly in the blue-green region.
Absorption spectra and action spectra
- Absorption spectrum
- A graph showing the percentage of light absorbed by a pigment (or pigments) at each wavelength.
- Action spectrum
- A graph showing the rate of photosynthesis at each wavelength of light.
Both graphs have wavelength (in nm, from about 400 to 700 nm) on the horizontal axis, which should also show the colours of light: violet and blue at the short-wavelength end, then green, yellow, orange and red.
| Absorption spectrum | Action spectrum | |
|---|---|---|
| Vertical axis | % of light absorbed | Rate of photosynthesis |
| Peaks | Blue and red for chlorophyll | Also blue and red |
| Green region | Low absorption by chlorophyll | Rate low but not zero, because accessory pigments absorb some light and some green light is absorbed as it passes through the leaf |
| How obtained | Shine each wavelength through a pigment extract and measure absorbance | Measure rate of oxygen production or carbon dioxide consumption under each wavelength |
The similar shape of the two graphs is evidence that the light absorbed by these pigments is the light used in photosynthesis.
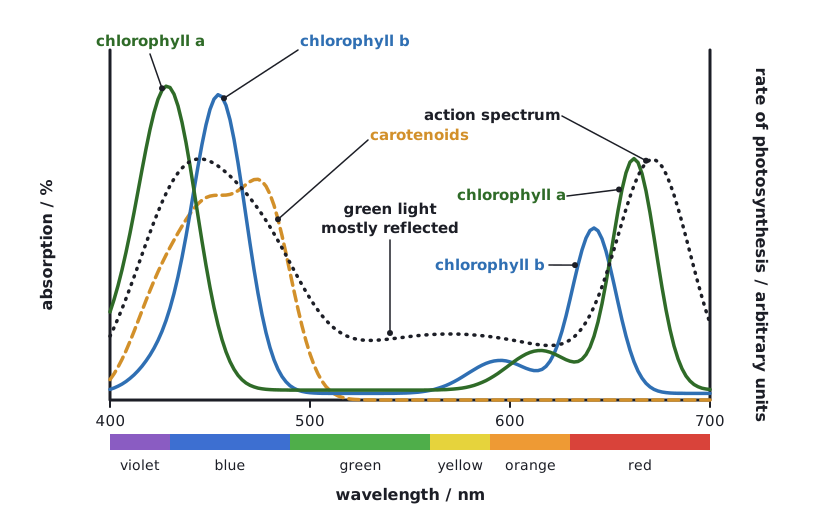 (opens full size in a new tab)
To make an action spectrum, calculate the rate at each wavelength (for example volume of oxygen ÷ time, or CO₂ uptake ÷ time), then plot rate against wavelength with points joined by a smooth curve or straight lines.
Written and checked against the IB Biology SL specification · Updated October 2026