
Continuous variation and box-and-whisker plotsSpec D3.2.14, D3.2.15
In short
Continuous variation is variation in which a trait can take any value in a range, due to polygenic inheritance and/or environmental factors, such as skin colour or height. Discrete variables, such as ABO blood group, fall into separate classes. A box-and-whisker plot shows a continuous variable's minimum, quartiles, median, maximum and outliers.
Polygenic inheritance is the control of one trait by many genes, each with a small additive effect. With many genes the number of possible genotypes is large, so phenotypes form a continuous range, usually close to a normal distribution. Environmental factors add further variation.
- Skin colour in humans is polygenic: several genes affect the amount and type of melanin. Environment also matters, because exposure to sunlight increases melanin production.
- A continuous variable, such as skin colour or height, can take any value in a range.
- A discrete variable, such as ABO blood group, falls into distinct categories with no intermediates.
- Mean
- The sum of all values divided by the number of values.
- Median
- The middle value when the data are in order.
- Mode
- The most frequent value (or class).
Box-and-whisker plots
A box-and-whisker plot displays six aspects of a data set: outliers, minimum, first quartile (Q1), median, third quartile (Q3) and maximum. The box runs from Q1 to Q3 with a line at the median. The whiskers reach the lowest and highest values that are not outliers.
Outliers in student height data
Heights of a class of students (cm): Q1 = 160, median = 166, Q3 = 172. The shortest student is 145 cm and the tallest is 191 cm. Determine whether either is an outlier.
- IQR = 172 − 160 = 12 cm.
- 1.5 × IQR = 18 cm.
- Upper limit = 172 + 18 = 190 cm. Lower limit = 160 − 18 = 142 cm.
- 191 cm > 190 cm, so it is an outlier. 145 cm > 142 cm, so it is not.
Answer: 191 cm is an outlier (plotted as a separate point); the upper whisker ends at the tallest non-outlier. 145 cm is the minimum.
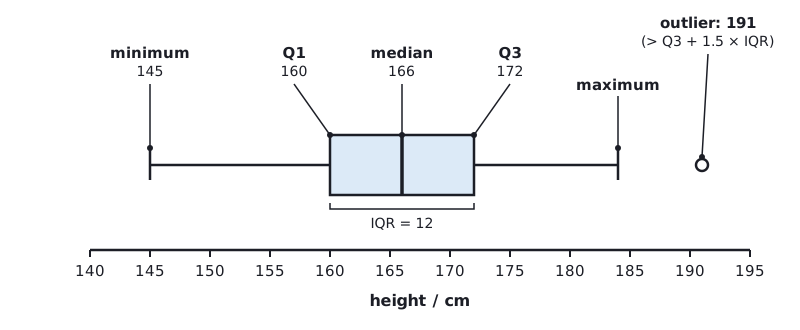 (opens full size in a new tab)
Box plots let you compare two samples quickly: compare medians for the typical value and IQRs for spread. State the units every time.
Linking question: what are the principles of effective sampling in biological research? A larger random sample gives quartiles and medians that better represent the population.
Quick check
Why do AA and Aa individuals have the same phenotype?
Show answer
One dominant allele produces enough functional protein for the trait to appear.
Give the genotype of a person with blood group O.
Show answer
ii.
What phenotype does a heterozygote show in incomplete dominance?
Show answer
An intermediate phenotype, e.g. pink four o'clock flowers.
State the outlier rule for a box-and-whisker plot.
Show answer
More than 1.5 × IQR above Q3 or below Q1.
Written and checked against the IB Biology SL specification · Updated October 2026