

Producers, consumers and food chainsSpec 4.7.2.1
Photosynthetic organisms are the producers of biomass for life on Earth. Feeding relationships within a community can be represented by food chains.
All food chains begin with a producer which synthesises molecules. This is usually a green plant or alga which makes glucose by photosynthesis.
| Name | What it does | Example |
|---|---|---|
| Producer | Makes glucose by photosynthesis | Grass |
| Primary consumer | Eats the producer | Grasshopper |
| Secondary consumer | Eats the primary consumer | Frog |
| Tertiary consumer | Eats the secondary consumer | Snake |
Consumers that kill and eat other animals are predators, and those eaten are prey.
 Tap to enlarge
Sampling: distribution and abundanceSpec 4.7.2.1
Ecologists use experimental methods with quadrats and transects to find the distribution (where a species is found) and abundance (how many there are) of species in an ecosystem.
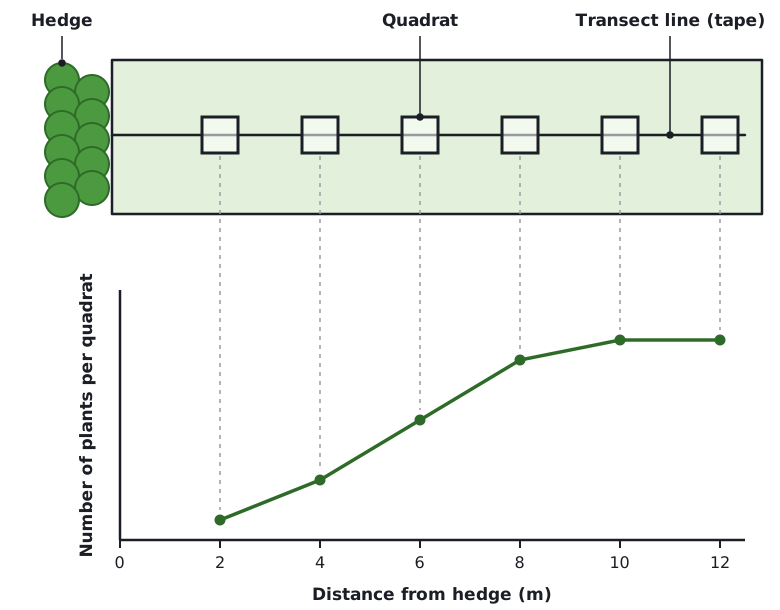
- A quadrat is a square frame placed on the ground. You count the organisms inside it.
- A transect is a line (such as a tape measure) laid across the ground. You place quadrats along it at regular intervals to see how the species changes along the line.
 Tap to enlarge
Method: population size
- Choose the habitat and the species to count, for example a plant such as daisies on a field.
- Place the quadrat at random positions. Use a random number generator to pick coordinates on a grid laid out with two tape measures. Random placement avoids bias.
- Count the organisms of the chosen species inside the quadrat each time.
- Repeat many times, for example 10 or more quadrats, so that the sample is representative.
- Calculate the mean number per quadrat.
- Estimate the population size. If the quadrat is not 1 m², first find the mean per m² (mean per quadrat ÷ area of the quadrat). Then: population = mean number per m² × total area of the habitat in m².
Method: effect of a factor on distribution
- Lay a transect line across the habitat where the factor changes, for example from an area of shade into an open area.
- Place a quadrat at regular intervals along the line, for example every 2 metres.
- At each position count the organisms of the species, and measure the factor (for example light intensity with a light meter, or soil moisture).
- Record the results in a table and plot a graph of number of organisms against distance or against the value of the factor.
Control variables include the size of the quadrat, the species being counted, the time of day, and the person doing the counting. Take care outdoors: wear gloves if needed, avoid harmful plants, take care near water and wash your hands afterwards.
A typical result is that the number of organisms of a species changes along the transect as the factor changes. For example, the number of a plant species may be lower under trees where there is less light, and higher in the open.
Mean, mode and median
- Mean
- The total of all the values divided by the number of values.
- Mode
- The value that occurs most often.
- Median
- The middle value when the values are in order. With an even number of values, it is halfway between the two middle values.
Mean, mode and median of quadrat counts
A student counted daisies in 8 quadrats and got: 2, 4, 4, 5, 6, 7, 4, 8. Calculate the mean, mode and median. Then estimate the population in a field of 300 m², using quadrats of area 0.25 m².
- Mean: add the values: 2 + 4 + 4 + 5 + 6 + 7 + 4 + 8 = 40. Divide by 8 quadrats: 40 ÷ 8 = 5.
- Mode: the most common value is 4 (it appears three times).
- Median: put the values in order: 2, 4, 4, 4, 5, 6, 7, 8. The middle two values are 4 and 5, so the median is 4.5.
- Population estimate: mean per quadrat is 5 in 0.25 m², so per m² is 5 ÷ 0.25 = 20. Over 300 m²: 20 × 300 = 6000.
Answer: Mean = 5, mode = 4, median = 4.5. Estimated population = 6000 daisies.
Plotting graphs
Choose a bar chart for categories such as different species, and a line graph for continuous data such as distance along a transect. Put the independent variable on the x-axis. Choose a scale that uses more than half of the grid, goes up in equal steps, and label each axis with its quantity and unit.
Predator-prey cyclesSpec 4.7.2.1
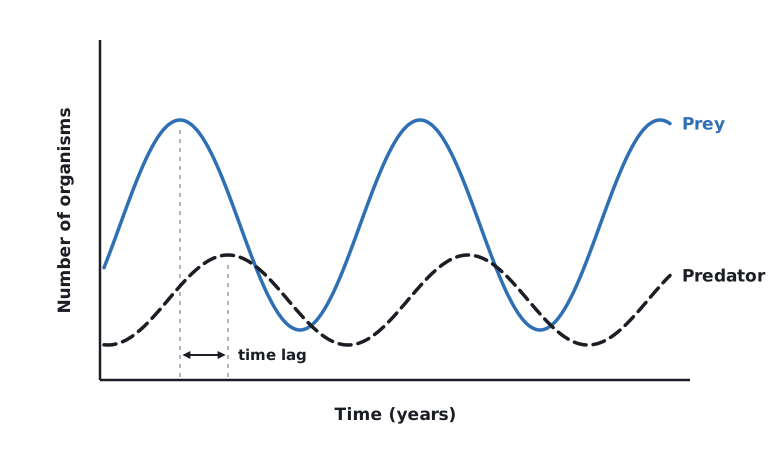
In a stable community the numbers of predators and prey rise and fall in cycles.
- Prey numbers are high, so there is plenty of food for the predators.
- Predator numbers rise as they eat more prey and breed.
- Prey numbers fall as more of them are eaten.
- With less food, predator numbers fall.
- Fewer predators means fewer prey are eaten, so prey numbers rise again.
 Tap to enlarge
How materials are cycledSpec 4.7.2.2
Many different materials cycle through the abiotic and biotic components of an ecosystem. All materials in the living world are recycled to provide the building blocks for future organisms.
The carbon cycle
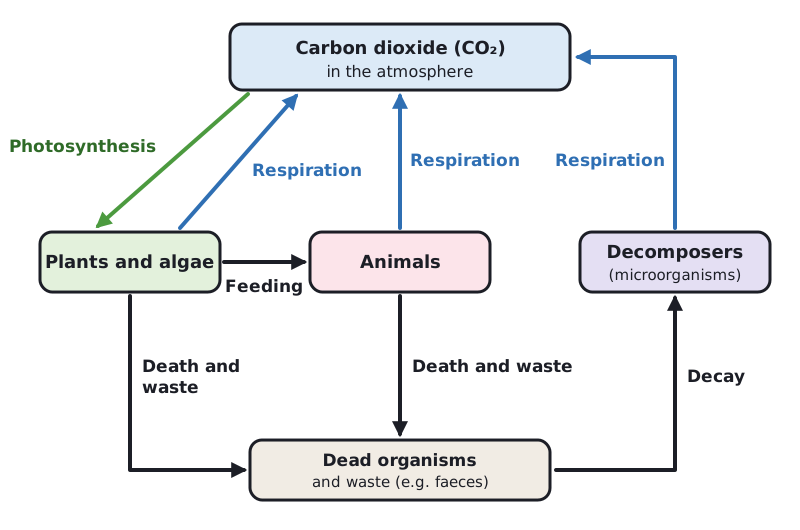
The carbon cycle returns carbon from organisms to the atmosphere as carbon dioxide to be used by plants in photosynthesis.
- Plants and algae take in carbon dioxide from the atmosphere for photosynthesis, and make glucose and other molecules.
- Carbon passes along food chains as animals eat the plants, and then other animals.
- Plants, animals and decomposing microorganisms release carbon dioxide into the atmosphere by respiration.
- When organisms die, microorganisms decompose them. They release carbon dioxide by respiration.
 Tap to enlarge
Carbon is important to living organisms because the main molecules they are built from, such as carbohydrates, proteins and fats, contain carbon. The cycle makes sure that carbon is available for new organisms.
The water cycle
The water cycle provides fresh water for plants and animals on land before draining into the seas. Water is continuously evaporated and precipitated.
- Water evaporates from the sea, from the land and from plants.
- The water vapour rises and cools, and condenses to form clouds.
- Water falls as precipitation, such as rain, hail and snow.
- The fresh water on land is used by plants and animals before draining into rivers and then the seas.
Water is important to living organisms because it is needed in cells, plants need it for photosynthesis, and land plants and animals need a supply of fresh water.
The role of microorganisms
Microorganisms that decompose dead plants, dead animals and waste have an important role in cycling materials through an ecosystem. They return carbon to the atmosphere as carbon dioxide (by respiration) and return mineral ions to the soil, where plants take them up.
DecompositionSpec 4.7.2.3Triple only
Decay is the breakdown of dead biological material by microorganisms. The rate of decay depends on the conditions the decomposers are in.
| Factor | Effect on the rate of decay |
|---|---|
| Temperature | Warmer conditions speed up decay, because the enzymes and the respiration of the microorganisms work faster, until an optimum. If it is too hot, the enzymes denature and decay slows. In cold conditions, decay is slow |
| Water | Microorganisms need water to grow and be active. More water (moist conditions) means faster decay. Dry material decays slowly |
| Availability of oxygen | Most decomposers need oxygen for aerobic respiration, so more oxygen means faster decay. With little or no oxygen, decay is slower |
Compost and biogas
Gardeners and farmers try to provide optimum conditions for rapid decay of waste biological material. The compost produced is used as a natural fertiliser for growing garden plants or crops.
Anaerobic decay (decay without oxygen) produces methane gas. Biogas generators can be used to produce methane gas as a fuel.
Calculating rate changes
Rate of decay
The mass of dead leaves in a compost heap falls from 80 g to 56 g in 12 days. Calculate the mean rate of decay.
- Change in mass = 80 − 56 = 24 g.
- Rate = change in mass ÷ time = 24 g ÷ 12 days = 2 g per day.
Answer: 2 g per day
You may also be asked to translate information between numerical and graphical form, and to plot a graph, for example mass of material or pH against time. Choose a scale that uses more than half the grid and label the axes with units.
- Put a set volume of milk into a test tube. Add a set volume of sodium carbonate solution, which makes it alkaline, and a few drops of phenolphthalein indicator, which is pink in alkaline conditions.
- Put this tube, and a separate tube of lipase solution, into a water bath at the chosen temperature. Leave them until they reach that temperature.
- Add a set volume of lipase to the milk, stir and start a stopwatch.
- Stop the stopwatch when the pink colour disappears. Lipase breaks down the fat in milk into fatty acids, which lower the pH.
- Repeat at a range of temperatures, for example 20, 30, 40 and 50 °C, and repeat each temperature.
- Calculate the rate for each temperature as 1 ÷ time taken.
Another version leaves fresh milk at different temperatures and measures its pH at regular intervals with a pH probe. As bacteria in the milk decay it, acid is produced and the pH falls.
The independent variable is the temperature. The dependent variable is the time taken for the colour to change (or the change in pH). Control variables: the volume of milk, the volume and concentration of lipase and sodium carbonate, and the number of drops of indicator.
A typical result is that the rate increases as the temperature rises, up to an optimum. Above the optimum the rate falls, because the enzymes denature.
Safety: wear eye protection, do not taste the milk, wash your hands afterwards and take care with hot water baths.
Impact of environmental changeSpec 4.7.2.4Triple onlyHigher tier
Environmental changes affect the distribution of species in an ecosystem. These changes include:
- temperature
- availability of water
- composition of atmospheric gases.
The changes may be seasonal, geographic or caused by human interaction.
| Type of change | Example of how it could affect distribution |
|---|---|
| Seasonal | Temperature and rainfall change through the year, so some species are only found in the area in particular seasons, such as animals that migrate away for winter |
| Geographic | Temperature and the availability of water are different in different places, for example further from the equator or higher up a mountain. A species is only found where the conditions suit it |
| Human interaction | Burning fossil fuels changes the composition of atmospheric gases and contributes to rising temperatures. Farming or building can change the water available |
To evaluate the impact, use the information given. Say which species are affected, how (more or fewer, moved to a different place), and whether the effect is likely to be large, small, short term or long term.
Quick check
What does a food chain always begin with?
Show answer
A producer, usually a green plant or alga that makes glucose by photosynthesis.
Why do ecologists use a transect?
Show answer
To see how the distribution of a species changes along a line as a factor changes.
In a predator-prey graph, which peak comes first?
Show answer
The prey peak, followed by the predator peak.
Which organisms return carbon dioxide and mineral ions to the environment when material decays?
Show answer
Microorganisms (decomposers).
What does the water cycle provide for plants and animals on land?
Show answer
Fresh water, before it drains into the seas.