

Factors that affect the rate of photosynthesisSpec 4.4.1.2
Four factors affect the rate of photosynthesis. If one of them is in short supply, it limits the rate. Raising any other factor will make no difference until the limiting factor is increased.
| Factor | Effect on rate | Why |
|---|---|---|
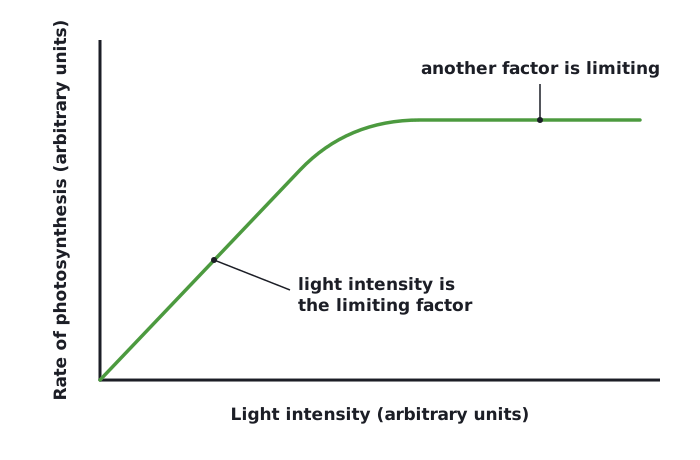
| Light intensity | Rate increases as light intensity increases, up to a point | Light provides the energy for the reaction. When light is no longer the limiting factor, the rate levels off. |
| Carbon dioxide concentration | Rate increases as concentration increases, up to a point | Carbon dioxide is a reactant. When it is no longer limiting, the rate levels off. |
| Temperature | Rate increases as temperature increases up to an optimum, then falls | Photosynthesis is controlled by enzymes. Warmer particles move faster and collide more often. Above the optimum, the enzymes denature and the rate drops quickly. |
| Amount of chlorophyll | Less chlorophyll means a lower rate | Chlorophyll absorbs the light. Fewer chloroplasts or damaged leaves (for example from disease) absorb less light. |
Measuring and calculating the rate
You can measure the rate of photosynthesis by finding how much oxygen is made, or how many bubbles are released, in a set time. The bigger the volume or number of bubbles, the faster the rate.
Calculating a rate
A piece of pondweed produced 24 cm³ of oxygen in 8 minutes. Calculate the rate of photosynthesis in cm³ per minute.
- rate = volume ÷ time
- rate = 24 ÷ 8
Answer: 3 cm³ per minute
Rearranging the equation
A different piece of pondweed photosynthesises at 2.5 cm³ per minute. How long will it take to produce 15 cm³ of oxygen?
- rate = volume ÷ time, so time = volume ÷ rate
- time = 15 ÷ 2.5
Answer: 6 minutes
Plotting and reading graphs
- Put the factor you change (the independent variable) on the x-axis and the rate on the y-axis.
- Choose a scale that uses more than half of the grid, with equal steps on each axis.
- Label both axes with the quantity and the unit.
- Plot the points accurately and draw a smooth line or curve of best fit.
- To read a graph, find the value on one axis and follow it across to the line, then down or across to the other axis. You can then write the values in a table, or draw a graph from a table.
For a graph with one limiting factor, the rate rises steeply, then curves over and becomes flat. In the rising part the factor on the x-axis is limiting. In the flat part another factor is limiting.
 Tap to enlarge