

Handling data about diseaseSpec 4.2.2.5
You need to be able to translate disease incidence information between graphical and numerical forms. Incidence is how often a disease occurs in a population.
- Construct and interpret frequency tables and diagrams.
- Use bar charts for data in separate categories, and histograms for continuous data grouped into ranges.
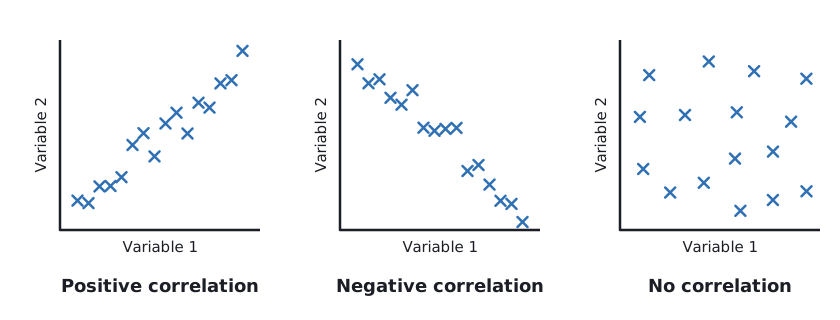
- Use a scatter diagram to identify a correlation between two variables. A positive correlation means one variable increases as the other increases. A negative correlation means one decreases as the other increases. No pattern means no correlation.
Sampling
It is not possible to test everyone, so scientists collect data from a sample. In epidemiological studies, a larger sample that is representative of the population gives more reliable data.
Disease incidence
In a town of 40 000 people, 60 new cases of a disease were recorded in one year. Calculate the number of new cases per 100 000 people.
- Divide the number of cases by the population: 60 ÷ 40 000 = 0.0015.
- Multiply by 100 000.
Answer: 150 cases per 100 000 people
 Tap to enlarge