

Sampling: distribution and abundanceSpec 4.7.2.1
Ecologists use experimental methods with quadrats and transects to find the distribution (where a species is found) and abundance (how many there are) of species in an ecosystem.
- A quadrat is a square frame placed on the ground. You count the organisms inside it.
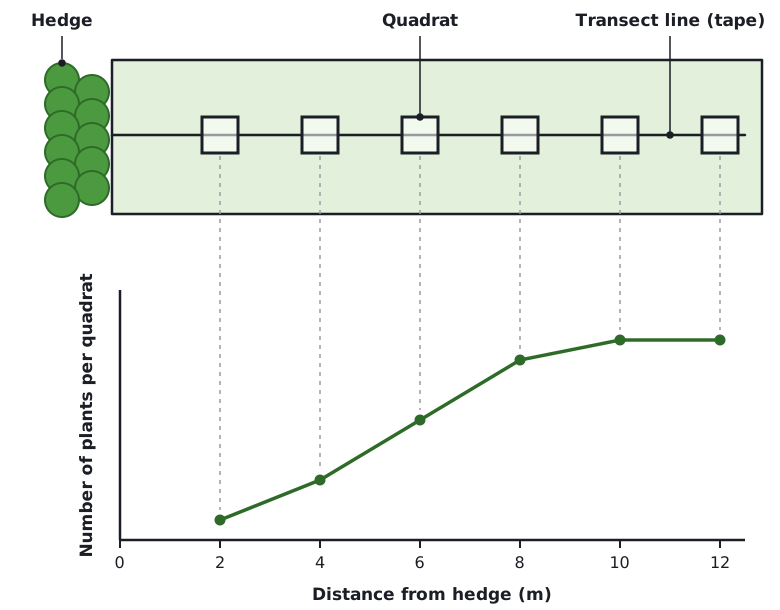
- A transect is a line (such as a tape measure) laid across the ground. You place quadrats along it at regular intervals to see how the species changes along the line.
 Tap to enlarge
Method: population size
- Choose the habitat and the species to count, for example a plant such as daisies on a field.
- Place the quadrat at random positions. Use a random number generator to pick coordinates on a grid laid out with two tape measures. Random placement avoids bias.
- Count the organisms of the chosen species inside the quadrat each time.
- Repeat many times, for example 10 or more quadrats, so that the sample is representative.
- Calculate the mean number per quadrat.
- Estimate the population size. If the quadrat is not 1 m², first find the mean per m² (mean per quadrat ÷ area of the quadrat). Then: population = mean number per m² × total area of the habitat in m².
Method: effect of a factor on distribution
- Lay a transect line across the habitat where the factor changes, for example from an area of shade into an open area.
- Place a quadrat at regular intervals along the line, for example every 2 metres.
- At each position count the organisms of the species, and measure the factor (for example light intensity with a light meter, or soil moisture).
- Record the results in a table and plot a graph of number of organisms against distance or against the value of the factor.
Control variables include the size of the quadrat, the species being counted, the time of day, and the person doing the counting. Take care outdoors: wear gloves if needed, avoid harmful plants, take care near water and wash your hands afterwards.
A typical result is that the number of organisms of a species changes along the transect as the factor changes. For example, the number of a plant species may be lower under trees where there is less light, and higher in the open.
Mean, mode and median
- Mean
- The total of all the values divided by the number of values.
- Mode
- The value that occurs most often.
- Median
- The middle value when the values are in order. With an even number of values, it is halfway between the two middle values.
Mean, mode and median of quadrat counts
A student counted daisies in 8 quadrats and got: 2, 4, 4, 5, 6, 7, 4, 8. Calculate the mean, mode and median. Then estimate the population in a field of 300 m², using quadrats of area 0.25 m².
- Mean: add the values: 2 + 4 + 4 + 5 + 6 + 7 + 4 + 8 = 40. Divide by 8 quadrats: 40 ÷ 8 = 5.
- Mode: the most common value is 4 (it appears three times).
- Median: put the values in order: 2, 4, 4, 4, 5, 6, 7, 8. The middle two values are 4 and 5, so the median is 4.5.
- Population estimate: mean per quadrat is 5 in 0.25 m², so per m² is 5 ÷ 0.25 = 20. Over 300 m²: 20 × 300 = 6000.
Answer: Mean = 5, mode = 4, median = 4.5. Estimated population = 6000 daisies.
Plotting graphs
Choose a bar chart for categories such as different species, and a line graph for continuous data such as distance along a transect. Put the independent variable on the x-axis. Choose a scale that uses more than half of the grid, goes up in equal steps, and label each axis with its quantity and unit.