

Practical: distribution and biodiversitySpec 4.4B
The distribution of an organism is where it is found. Quadrats can be used to investigate how organisms are distributed in their habitats, and to measure the biodiversity of a habitat.
Distribution: a belt transect
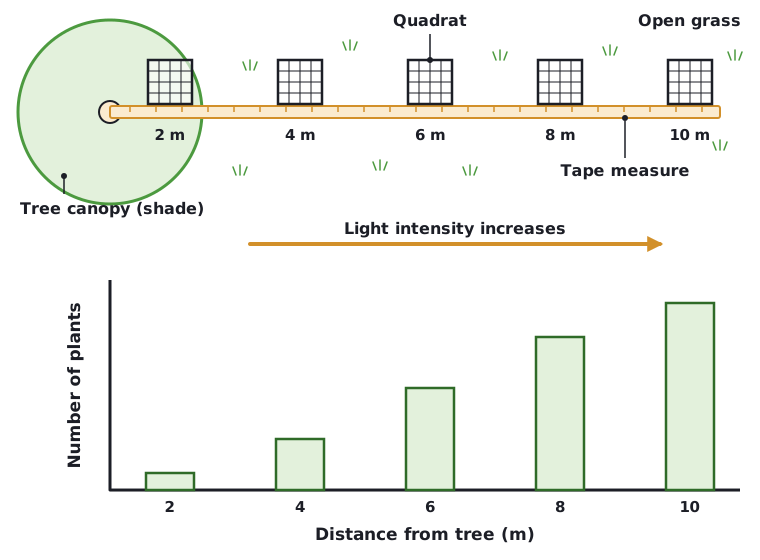
- Lay a tape measure in a straight line (a transect) across the habitat, for example from under a tree out into open grass.
- Place a quadrat at regular intervals along the tape, such as every 2 m.
- At each position count the organisms of the species in the quadrat, and measure an environmental factor such as light intensity with a light meter.
- Record both in a table and plot a graph to look for a pattern.
Typical result: plants that need a lot of light increase in number as you move from shade into open ground. A correlation like this does not prove that light intensity is the cause.
Measuring biodiversity
- Place quadrats randomly in the habitat.
- In each quadrat, identify every species present, using a key if needed, and record how many different species there are.
- Repeat for many quadrats, then work out the mean number of different species per quadrat.
- Compare habitats: the one with the higher mean number of species has the higher biodiversity.
- Independent variable: position along the transect, or the habitat being compared.
- Dependent variable: the number of the species, or the number of different species, per quadrat.
- Control variables: quadrat size, number of quadrats and the person counting.
- Safety: wear suitable footwear, wash hands after handling soil or plants, and do not touch plants you cannot identify.
Practical:
Use a transect to show a change along a gradient. Use random quadrats to compare habitats. Biodiversity is measured by counting the number of different species, not the number of individuals.
 (opens full size in a new tab)