

Core practical: quadrats and belt transectsSpec 9.5
Field-work techniques let you investigate the relationship between organisms and their environment, for example how the number of a plant species changes with light intensity.
- Quadrat
- A square frame used to sample the organisms in a small, known area.
- Belt transect
- A line (a tape measure) laid across a habitat, with quadrats placed along it at regular intervals, to show how organisms change along an environmental gradient.
Random sampling with quadrats
- Mark out the study area with two tape measures laid at right angles along two sides.
- Use a random number generator to pick two coordinates, one along each tape measure.
- Place the quadrat at that point and count the number of the chosen species inside it, or estimate the percentage cover.
- Repeat for many quadrats and calculate the mean.
Belt transect
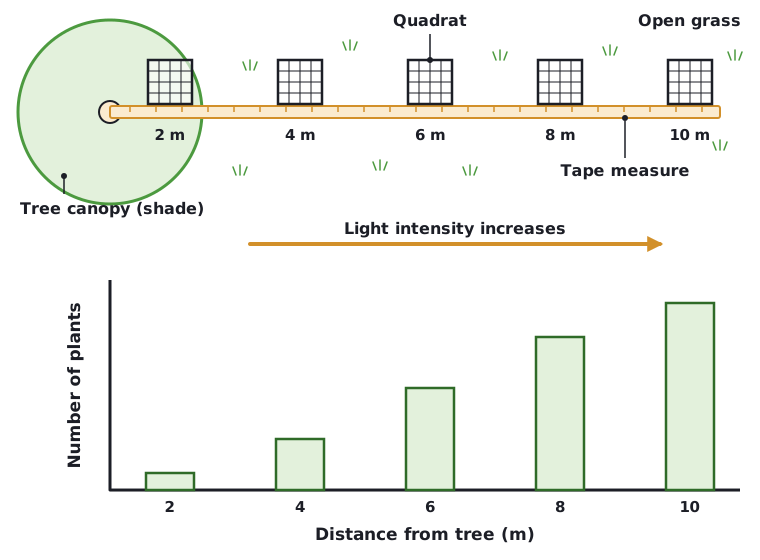
- Lay a tape measure in a straight line across the habitat, for example from under a tree out into open grass.
- Place a quadrat at regular intervals along the tape, such as every 2 m.
- At each position count the organisms in the quadrat and measure the environmental factor, for example light intensity with a light meter or soil moisture with a moisture meter.
- Record both in a table and plot a graph to look for a pattern.
Variables and safety
- Independent variable: the position along the transect, or the environmental factor such as light intensity.
- Dependent variable: the number or percentage cover of the species.
- Control variables: the quadrat size, the species being counted and the person counting.
- Safety: wear suitable footwear, wash hands after handling soil or plants, and do not touch plants you cannot identify.
Typical result: along a transect from shade into open ground, plants that need lots of light increase in number as light intensity increases. A scatter diagram of number against light intensity can show a correlation, but a correlation alone does not prove that one factor causes the other.
 Tap to enlarge